In this blog post I’m going to talk about our .NET 8.0 GC feature called DATAS (Dynamic Adaptation To Application Sizes). To talk about this work I think it’s necessary to first give some background on what kind of scenarios this feature is aiming to make better. This section is quite long because I will discuss some existing solutions for this problem space and why they are not sufficient for the scenarios DATAS is targeting. Feel free to skip it if you want to dive into the feature right away.
 II’m adopting the foot note style to explain things because I find it helpful for providing more info while keeping the main portion of the post more focused on the topic at hand.
Background and problem space
In the past couple of .NET releases, we really focused on making the GC work more efficient and the GC pauses shorter¹. Most of those optimizations we did were targeting larger workloads². These workloads usually use Server GC. Server GC was designed with maximizing throughput in mind and has a reputation that it uses a lot of memory. In fact I’ve heard some folks say “Server GC tries to use as much memory as possible” which is well, not the case😊. Server GC doesn’t try to use a lot of memory — it just by default has the potential to use more memory when there is a lot of memory available. Let me explain why.
One of the most important factors that contribute to more memory usage is the number of heaps. Having more heaps doesn’t automatically mean you’ll use more memory — you could just have less memory per heap. And this is the case for long lived data — there’s only so much long-lived data so if you have more heaps each heap will have less long live data. But if you look at it from the user allocation point of view, it means you now have multiple heaps to allocate on instead of one with Workstation GC. Or at least that portion could be N times more if you have N heaps³. And by default, Server GC will have the same number of heaps as the number of logical processors on the machine⁴. This means the problem is not just that your heap may grow to a bigger size. It’s that it’s unpredictable — if you run your workload on a machine with more processors you might see a bigger size.
Another important but more subtle factor is Background GC. In general, for gen2 GCs we choose to do Background GCs instead of compacting (which incur long GC pauses if the heap is large). What this means is during peak hours, your GC heap could grow to a large size simply because of the demand. But after that if we are not under memory pressure, we will most likely not do a full compacting GC so the heap size will stay that large. So next time you hit peak hours the heap will be fully utilized again. Note that this means if you happen to look at the heap size not during peak hours you will see a lot of fragmentation on the heap (it’s BGC’s job to build up fragmentation so it can use that space to allocate objects into).
This situation is fine if you aren’t using the machine to do other things during non-peak hours. But if you are running in a memory constraint environment like a container with a memory limit specified, often folks’ intention is to pack as many containers as possible on a VM so they don’t want to leave memory sitting around unused. In other words, when the application itself isn’t needing so much memory, it’s desirable to shrink the GC heap size accordingly.
Ways to control the GC heap size before .NET 8
- We could change the allocation budget. For example, for the generations user code actually allocates in which means gen0, LOH and POH, if we reduce their budgets, the GC heap isn’t allowed to grow as big before the next GC is triggered, since the user code will not be able to allocate as much in-between GCs.
- We could decide to do a full compacting GC instead of a BGC. It’s very common to do a compacting GC for ephemeral collections. But in large workloads, most of the memory does not live in ephemeral generations. In order to reduce the gen2 size, we could choose to do a BGC sooner or, if gen2 has already grown very large with a lot of fragmentation (ie, the peak vs non peak situation I described above) we could do a full compacting GC. Note that when the memory load gets high, ie, there’s not a lot of available memory, a full compacting GC will automatically happen.
- A config called GCHeapCount is provided to change the number of heaps. This is a technique that many folks have used. However, it’s not very flexible for the following reasons –
- The heap count cannot change after the runtime is initialized, which means you may need to specify a different value for this config if you are running in a different environment. A different environment could mean you need the process to handle more concurrent requests because it’s during peak hours, or on a different machine with more memory so you can afford to give this process more memory.
- Instead of changing the heap count, we could distribute the total allocation budget over the number of heaps. But this doesn’t scale. We wouldn’t want a heap count that’s very disproportional⁵. In other words, having a reasonable heap count is important to keep things running smoothly for the GC.
Surprising results for small apps with Server GC
It’s usually the right choice to turn Server GC on for a real web application instead of a simple test app. But it does not help if folks who are just “trying it out” don’t get a good experience because they see a big heap when the app doesn’t do much. We really want to improve this experience.
DATAS
The .NET 8 GC introduces an experimental feature called DATAS which stands for Dynamic Adaptation To Application Sizes. What does “application size” mean exactly? This is the LDS (Live Data Size) from GC’s point of view, meaning that if we did the most aggressive GC possible, this is how much memory your application uses. Another way to look at it is this is your long lived data + whatever inflight data you have when a GC occurs.
The goal for DATAS is that you no longer need to do various configurations to try to achieve a heap size proportional to your application usage. The 2 main cases we target with DATAS are -
1) Bursty workloads running in memory constraint environments. DATAS aims to retract the heap size back when the application doesn’t require as much memory and grow it when the app requires more. This is especially important for apps running in containers with memory limits.
2) Small workloads using Server GC — for example, if someone wants to try out a small asp.net core app to see what the experience is like in .NET, DATAS aims provide a heap size much more inline with what the small app actually needs.
When we started this feature, within teams in the .NET org some folks were referring to it as “the Dynamic GC”. I did have to clarify there that GC has been dynamic in many ways over the history of .NET. What’s key in DATAS is the “adapting to application size” part. Of course GC has always been dynamic in some ways — it’s unrealistic to have a GC that serves the amount of workloads running .NET without it being dynamically tuned⁶.
How does the GC achieve that?
At a high level, the current DATAS design does the following to adapt -
- adjust the number of heaps appropriately to allow things to run fairly smoothly and
- adjust allocation budgets and policy for doing full compacting GCs to adapt to application sizes
The kinds of tuning we can do are limited by the mechanisms available to us. The mechanism in 1) which is being able to adjust the number of heaps was developed as part of our 8.0 work (it’s still being worked on — I will talk about this in a future post). As part of the GC development work, we are always adding new mechanisms so in the future we’ll have even more flexibility to adjust things in the GC.
Let’s take a look at the policies we use to do our adjustments as they are the major factor that determines the outcome. In the next couple of blog posts I will provide details on some of the mechanisms themselves as they are quite intricate and I know many of my readers really enjoy reading about internals of the GC.
Because this is currently heavily under development, some of what I describe will very likely change. I was thinking to wait till this is more baked but lots of people have expressed interest in this work and I also thought there’s merit to talk about things in early stages so we can see how they evolve.
Policies to adjust the number of heaps
When DATAS is on, we don’t want users to have to specify any configs to try to influence the heap size — it should happen automatically. Since we cannot predict how much memory a workload will need, DATAS will always start with one heap and adjust up or down as needed. “As needed” is determined by the combination of a throughput cost percentage and a space cost percentage that we’ll discuss in detail below.
We continuously measure these cost percentages and once every 3 GCs we pick a median value and use that to do our calculations.
Throughput cost
From the throughput perspective, the cost is how long you have to wait to do an allocation. For SOH allocations, they are usually very fast because most of the time they don’t even need to come to the GC (each time GC gives out memory, it’s enough for many small allocations). For UOH (meaning LOH and POH) allocations they will need to come to the GC for every allocation. When an allocating thread does need to come to the GC, it needs to take a per heap SOH or UOH lock. If this lock is contended, it means some allocating threads will need to wait. So we record the amount of time threads have to wait when the lock is contended. When we have enough heaps, this lock is contended very infrequently which means the wait time from all allocating threads should be insignificant.
When a GC is triggered, we record the duration of the GC.
The throughput cost percentage is then
throughput_cost = (total_SOH_wait time + total_UOH_wait time) / num_of_heaps +
                   GC duration
throughput_cost_percentage = throughput_cost / elapsed_time_since_the_last_GC
For ephemeral GCs this formula is quite reasonable — they are usually short and happen frequently. And during ephemeral GCs managed threads are paused. For full GCs this is very questionable — if we do a full blocking GC, it’s very likely the cost percentage will be very high which means it’ll never get picked because it’ll never be the median value. And of course for BGCs the GC duration is very different from pause duration. I have some changes that treat full GCs separately from ephemeral GCs. The idea is still the same but we take the elapsed time between full GCs.
The throughput cost percentage is a good indication to adjust the heap count up. Since we start from 1 heap, if the app starts to spin up lots of threads allocating, it’s definitely good to have more GC heaps so the contention goes down. On the other hand, if the app doesn’t do much, let’s say it’s a single threaded app, which means there will be no contention at all on the per heap lock. Unless the GC cost is high it will just stay at 1 heap.
Space cost
The space cost percentage is to determine if we are making the right tradeoff between how much GC runs and how much memory it uses. In general, the more memory GC can use, the less frequent it has to run. We calculate the per heap space cost percentage as
size_of_an_extra_heap / total_heap_sizeHow to define “size of an extra heap” requires some thoughts. An extra heap could be “what the user code allocates on a heap” (we will move some of the already survived memory from other heaps to this extra heap so that part already exists). Currently this is temporarily defined as the minimum gen0 budget. For one thing, if the heap size gets big enough, this will always be very tiny so it’s not useful. So this will certainly change.
Combining them
The way we look at the tradeoffs is –
· Would it be worth it to adjust up? Ie, would we save more in throughput cost than the extra space cost incurred by a significant amount? If so we adjust up.
· Otherwise, would it be worth to adjust down? Ie, would we save more in space cost than the extra throughput cost by a significant amount? If so we adjust down.
“A significant amount” is currently set as 1%. I also expect this to change to take the total heap size and other factors into consideration.
How much to adjust?
The current policy for adjustment is the following -
· If the throughput cost is really high (> 10%), we adjust up aggressively — our goal is to see if we can bring it down to 5%.
· If the throughput cost is fairly high (between 5% and 10%), we adjust by steps. So far we’ve used a simple policy for calculating the step for adjusting up and down based on the current number of heaps.
· Otherwise we look at our tradeoff to see if we should adjust up or down.
We apply exponential smoothing to make it more stable so we do fewer heap count changes. However, there are quite a few problems remaining to be solved.
· We can still be in a situation that one run’s max heap count is noticeably higher than another run’s because currently we just use the current number of heaps to calculate how much to adjust up/down. We’d definitely want to take the amount of work GC has to do (ie, the survived bytes) into consideration — if we have a small survivorship, that should contribute to calculating how much we should adjust.
· Right now we are not adjusting down aggressively enough. It’s true that we don’t want to change the heap count too often because it obviously takes work (I’ll talk about this in more detail in a future post). When the heap size is small, the amount of this work is small as well so we should be more free to change the heap count.
I also expect to make this more configurable. In general 5% is fine but some folks may want that number to be different. Since this is something easily measurable by users, we can take this as an input for our adjustment.
Policies to adapt to application sizes
Most of the policies are around adjusting the allocation budgets. In .NET 6 (and .NET Framework 4.8) we introduced a ConserveMemory config that I know many teams have made use of. Since I haven’t talked about it in my blog I’ll take the opportunity to describe it as we are definitely taking advantage of it for DATAS.
The idea behind this config is exactly about how much we allow the heap size to grow to relative to the LDS (at the time we implemented this config, it was only for gen2 as for a sizeable heap that’s where most of the data is). When we do a full GC, we know how much is survived in gen2 which is close to the LDS assuming most of your long term data is in gen2 (gen2 here refers to the logical generation 2 which includes UOH). The calculation below equates LDS to the gen2 survived bytes. Let’s say the gen2 allocation budget was X. If the gen2 budget is X, it means when a gen2 GC is triggered, the gen2 size is (X + LDS). The config value is interpreted as “how conservative do you want the GC to be at keeping the heap size down” so the larger it is, the smaller the heap is. Let’s say you specify 7, which is interpreted as 70% and it means we allow only 30% on the heap that’s not live data. So
(10 — C) / 10 = (10–7) / 10 = 30%And this 30% is (budget / (budget + LDS)). So
(10 — C) / 10 = (budget / (budget + LDS))
=>
budget = (10 / C - 1) * LDS
Then we take half of that just to be conservative (otherwise we might very well grow gen2 size which we try to avoid) and use that to set the gen2 budget.
Because BGC does not compact, if we are observing the transition from peak hours to non peak hours, our policy is to do a full compacting GC to reduce the heap size if we detect we are over the desired heap size.
DATAS effectively sets this config to 5 unless it’s set by the user. In DATAS we also modify the gen0 budget because for smaller workloads that can be a significant percentage of the total heap. But we do this differently because gen0 mostly holds temporary data so we calculate the budget the same way as we used to which is based on the gen0 survival rate. However, for DATAS we want the LDS to influence the gen0 budget when it’s small so gen0 doesn’t make the heap grow too large. As always we also want to make sure it doesn’t become too small so we set 2.5MB as the minimum gen0 budget.
Example Results
One of the test suites we’ve been using to do our validation for the feature is benchmarks⁷ from the asp.net team. The server is running on “aspnet-citrine-win” which is an Intel machine with 28 logical cores on 1 socket and 32GB DRAM.
On average, max working set has been reduced by 73% and throughput (RPS) has been regressed by 2.3%.
Individual benchmark results are in the charts below.
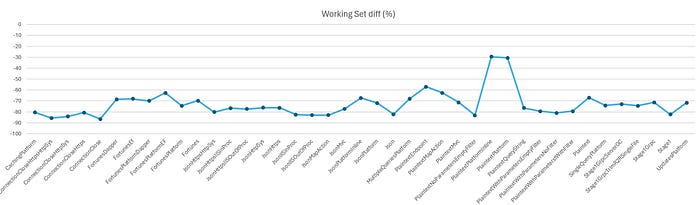
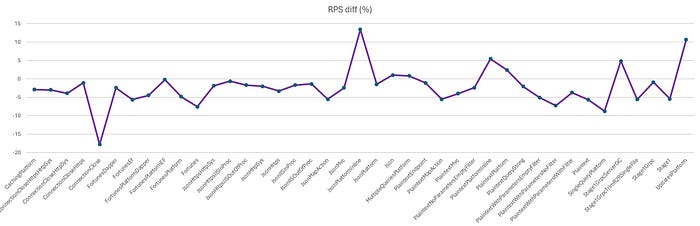
Note that some of these tests are very noisy and the 2 that regressed > 10% in throughput, JsonPlatformInline and UpdatesPlatform, are among the noisy ones. Going forward, we’ll report a volatility score for each benchmark. We have yet to do in-depth investigation on these benchmarks. Based on a cursory look, the % time in GC went from 0.0%/0.4% with Server GC to 0.2%/2.4% with DATAS for these 2 benchmarks respectively. So it doesn’t seem like that’s the cause but we will obviously need to investigate to understand why. In general, we certainly do not expect to regress the throughput this much.
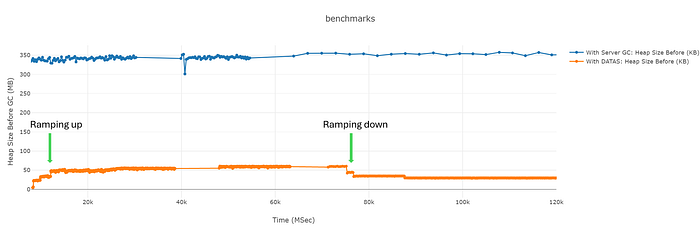
Since the current way of running these tests do not have a variable load, I’m including results from running the JsonMVC benchmark with a variable load to show how the heap size adapts when we change from a heavier load to a lighter load.
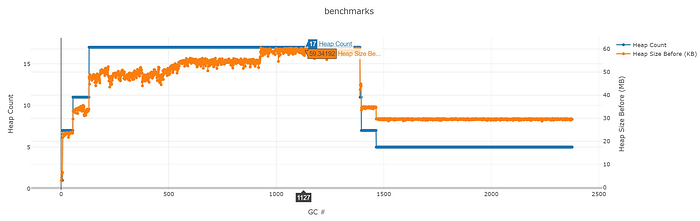
If we look at the heap count, we can see how it’s adjusted. The max it got adjusted to is 17.
(note this chart’s x-axis is different from the last one — it’s the GC indices instead of time)
How to use the feature
If you’d like to try it out, DATAS can be turned on via one of the following ways in .NET 8 (note that you always need to turn on Server GC). Note that if you set it to use Server GC but also config the heap count yourself, it will simply use Server GC with that many heaps and ignore that the adaptation mode is set.
1) via runtimeconfig.json –
“configProperties”: {
  "System.GC.Server": true,
  "System.GC.DynamicAdaptationMode": 1
}
2) via an msbuild property –
<PropertyGroup>
  <ServerGarbageCollection>true</ServerGarbageCollection>
  <GarbageCollectionAdaptationMode>1</GarbageCollectionAdaptationMode>
</PropertyGroup>
3) via an env var –
set DOTNET_gcServer=1
set DOTNET_GCDynamicAdaptationMode=1
In future releases, we plan to turn DATAS on by default so you’ll no longer need to do any configuration if you want to have the heap size adapt to what your application requires.
Footnotes
1. For example, use prefetch during marking. And by moving the GC heap from segments to regions (turned on by default in .NET 7) it enabled us to do optimizations that were much harder before such as being able to balance survivors easily for the generations we are collecting by moving the regions around between heaps.
2. By that I mean these workloads can afford to have a fairly large memory footprint but they have high demands on latency (so reducing the GC pauses can be critical for them). And they are usually expected to be active very often. Or when they are not active, they don’t need to share memory on the machine with other applications.
3. With Workstation GC you have one heap and let’s say the gen0 budget (ie, the amount of allocations that when exceeded will trigger a GC) is 10mb. If you have 8 heaps with Server GC it will be able to allocate 80mb before the next GC is triggered. Now you might’ve just added 70mb to your process’s memory usage than with Workstation GC. I say “might’ve” because this is a very simplistic way of looking at this problem as there are multiple factors that would affect the computation of the budget. For example, if the memory load is high, GC will reduce the budget accordingly so the total gen0 budget could be less than 8x that of Workstation GC’s. It could also be more than 8x because Server GC might allow a larger budget per heap.
4. Strictly speaking, this is not the # of processors on the machine — it’s the # that your process is allowed to use. So if your process is only affinitized to 4 processors out of 32 that the machine has, then you will get 4 heaps by default.
5. It’s very unlikely you’d want each heap to have a budget say is only 32k because that would mean you are triggering GCs too often. You also wouldn’t want each heap to get too much budget because that would mean allocating threads might have to wait for too long to get to allocate on a heap (when an allocating thread comes to the GC to get memory, it needs to take a lock for the heap it’s assigned to allocate on).
6. I think of the GC dynamic tuning as a threefold problem –
· How many conditions it adapts to and how well it adapts to them. GC already dynamically adapts to a wide range of things such as survival rates and physical memory load.
· How the dynamic tuning work relates to application metrics. Survival rate is not an app metric while memory usage is. We should be able to make statements like “my application uses ~Xmb memory so my GC heap memory usage should be ~Ymb where Y is proportional to X”. We’ve done tuning specifically in this space (eg, the ConserveMemory config) but DATAS takes it to a new level. In the future we also plan to adapt to other application metrics like a CPU percentage GC is allowed to take specified by the user.
· The tuning is never “let’s just optimize for this one metric and not care about anything else”. It really means having things run fairly smoothly in general while optimizing for a metric/set of metrics. There can be a point when the performance is no longer good because there’s simply too much stress on the GC. Obviously, we continue to make improvements in the GC which make GC be able to handle more stress.
7. I’ve excluded all AoT tests — since we do our perf testing with clrgc.dll and AoT currently does not supporting loading the standalone GC dll, we don’t have results for them. We are currently adding this support to AoT.